Who do you want when it matters?
McDavid is the easy answer. Hertl, an empty net and a few inconvenient numbers make it a better argument.
Five minutes left, down a goal, and you can send any skater in the NHL over the boards. Everyone says Connor McDavid.
Across the last three seasons — 4,192 games — Connor McDavid ranks eighth in late-comeback scoring rate. Tomas Hertl is first.
That gap reveals almost nothing about Hertl's clutch gene, and everything about a goalie sitting on the bench.
Five minutes left, goalie on the bench
We counted goals in the final five minutes of the third period when the scoring team trailed by one or two. Of 669 qualifying regular-season goals, 425 came with that team's goalie off the ice: 63.5%. A goal that cuts the deficit to one counts here, even if the comeback ends there.
| Rank | Player | Pts / 60 | Goalie off |
|---|---|---|---|
| 1 | Tomas HertlSJS, VGK | 6.55 | 10 of 15 |
| 2 | Mark StoneVGK | 6.43 | 7 of 11 |
| 3 | Nikolaj EhlersWPG, CAR | 5.51 | 6 of 9 |
| 4 | Troy TerryANA | 5.43 | 12 of 15 |
| 5 | Mitch MarnerTOR, VGK | 5.34 | 11 of 15 |
| 6 | Tyson FoersterPHI | 5.22 | 4 of 8 |
| 7 | Leo CarlssonANA | 4.96 | 8 of 13 |
| 8 | Connor McDavidEDM | 4.95 | 9 of 12 |
Goalie off: points with the player’s own goalie absent, out of all his late-comeback points. That column uses full totals; the rate uses only games with usable shifts. Teams shown cover the study period.
The extra attacker: Ten of Hertl's 15 points came with his team's net empty, and nine of 12 for McDavid. Pulling the goalie explains the setting, but not Hertl's lead — both players spent these minutes with an extra attacker.
Sample uncertainty: Hertl's rate rests on 14 points in 128.2 eligible minutes. Resampling those games 10,000 times places his approximate 95% interval between 3.35 to 10.27 points per 60, fully overlapping McDavid (4.95) and much of the league.
In overtime, count the pass too
Overtime offers a different test: next goal wins. Leon Draisaitl shares the regular-season overtime goals lead with nine; McDavid has only two.
Count the assists, however, and the picture inverts: McDavid has 19 points, including 15 primary assists, and leads the qualifying skaters at 16.51 points per 60.
Who ends overtime?
Regular season · All manpower situations · No shootoutsPoints per 60 eligible minutes · Covered games only
-
 Connor McDavid
16.51
17 points in 61.8 minutes
Connor McDavid
16.51
17 points in 61.8 minutes
-
 Leon Draisaitl
15.25
16 points in 63.0 minutes
Leon Draisaitl
15.25
16 points in 63.0 minutes
-
 Sebastian Aho
14.02
16 points in 68.5 minutes
Sebastian Aho
14.02
16 points in 68.5 minutes
-
 Kirill Kaprizov
10.00
11 points in 66.0 minutes
Kirill Kaprizov
10.00
11 points in 66.0 minutes
-
 Cole Caufield
8.45
13 points in 92.3 minutes
Cole Caufield
8.45
13 points in 92.3 minutes
-
 Nick Suzuki
7.74
15 points in 116.2 minutes
Nick Suzuki
7.74
15 points in 116.2 minutes
-
 Auston Matthews
7.56
9 points in 71.4 minutes
Auston Matthews
7.56
9 points in 71.4 minutes
Selected comparisons, not a league ranking by rate. Small samples and missing shifts limit comparisons; rates do not adjust for teammates, opponents or manpower.
Then look at who supplied Draisaitl's goals:
McDavid assisted on eight of Draisaitl's nine regular-season overtime goals. Seven of those assists were primary.
Shared production: Fourteen of Draisaitl's 17 overtime points came on goals that also credited McDavid. A leaderboard splits them onto separate rows; the scoring record shows they are two halves of the same play.
The playoffs, against your own standard
Overtime can end on one rush. The playoffs demand sustained production against matched checking lines. McDavid leads our qualifying playoff skaters at 3.87 points per 60 (81 points in 53 games overall), with Draisaitl second among our featured group at 3.79 (74 points).
Who carries a playoff run?
Playoffs · All periods and score statesThe full rate board has 485 skaters with at least 60 eligible playoff minutes. Draisaitl ranks fourth overall and second among the players shown. Totals include all completed games; rates use covered games.Points per 60 eligible minutes · Covered games only
-
Connor McDavid
3.87
81 points in 1254.5 minutes
-
Leon Draisaitl
3.79
74 points in 1172.8 minutes
-
 Nathan MacKinnon
3.40
40 points in 706.3 minutes
Nathan MacKinnon
3.40
40 points in 706.3 minutes
-
 Mikko Rantanen
3.33
43 points in 774.6 minutes
Mikko Rantanen
3.33
43 points in 774.6 minutes
-
 Matthew Tkachuk
3.20
45 points in 844.3 minutes
Matthew Tkachuk
3.20
45 points in 844.3 minutes
-
 Evan Bouchard
2.75
62 points in 1351.2 minutes
Evan Bouchard
2.75
62 points in 1351.2 minutes
-
Auston Matthews
2.45
15 points in 367.9 minutes
Selected comparisons, not a league ranking by rate. Small samples and missing shifts limit comparisons; rates do not adjust for teammates, opponents or manpower.
The Edmonton connection carries into the postseason: 37 of Draisaitl's 74 playoff points came on goals that also credited McDavid, with McDavid assisting on 15 of Draisaitl's 24 playoff goals.
How does that playoff production compare against a player's normal level? The scatterplot below compares regular-season and playoff scoring rates for all 367 skaters with at least ten playoff games. The dashed diagonal marks equal production:
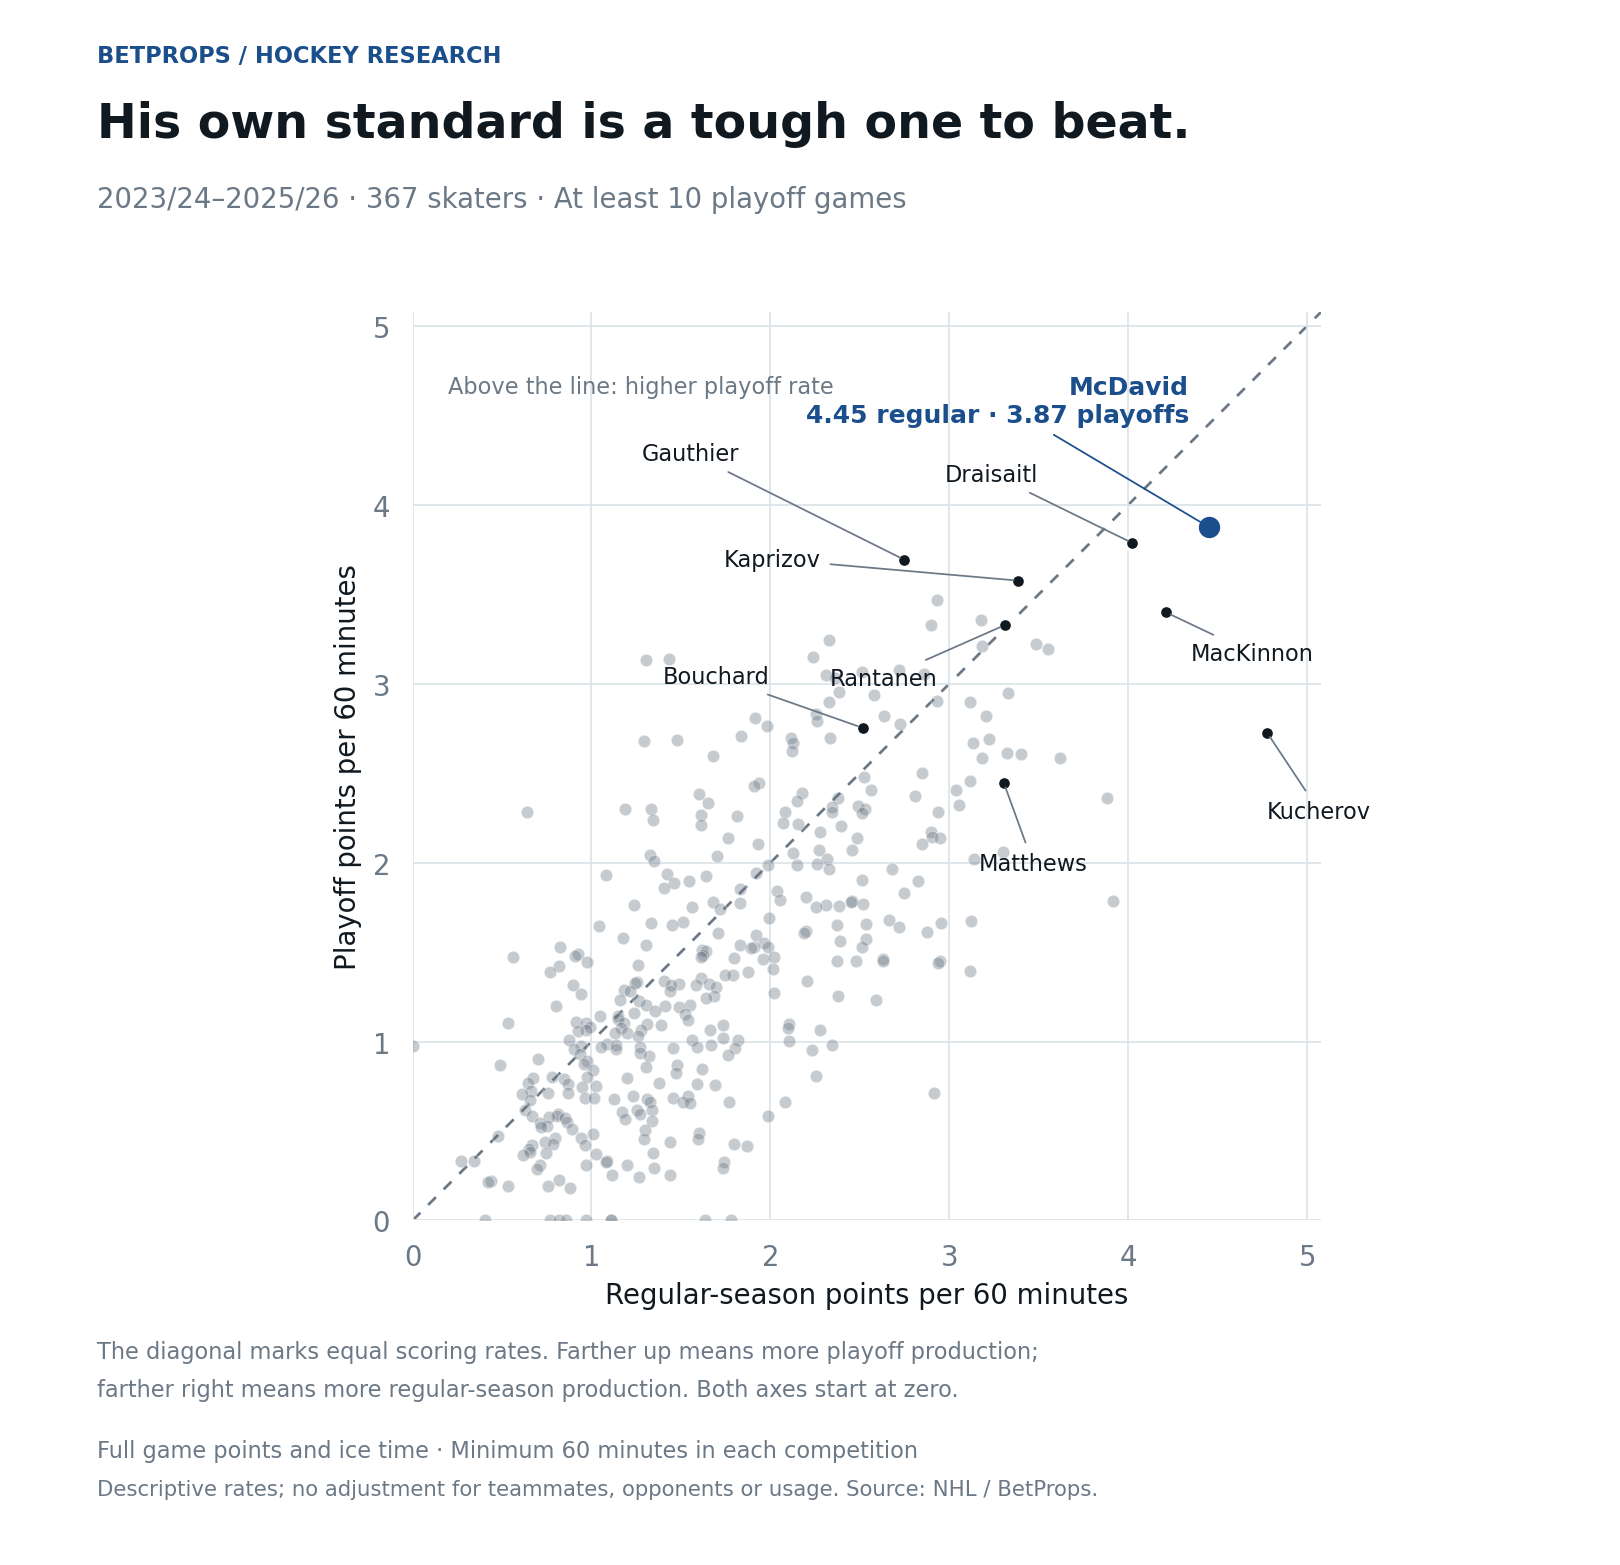
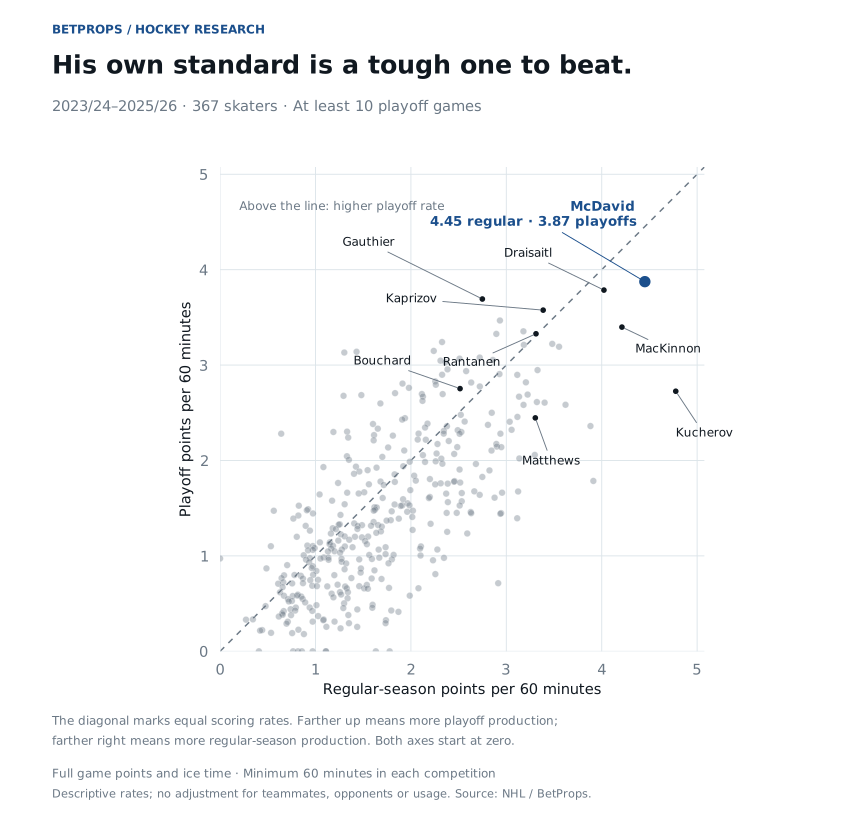
The lone ceiling: McDavid sits at 3.87 playoff points per 60 — the highest rate on the chart. Draisaitl (3.79) is the only skater close to him; nobody else tops 3.50.
Below the diagonal: McDavid’s regular-season baseline is an astronomical 4.45 points per 60 (second only to Nikita Kucherov at 4.78). He falls roughly 13% below the diagonal not because his game collapses in spring, but because sustaining a 4.45 rate against playoff checking lines like Vancouver's J.T. Miller unit is mathematically brutal.
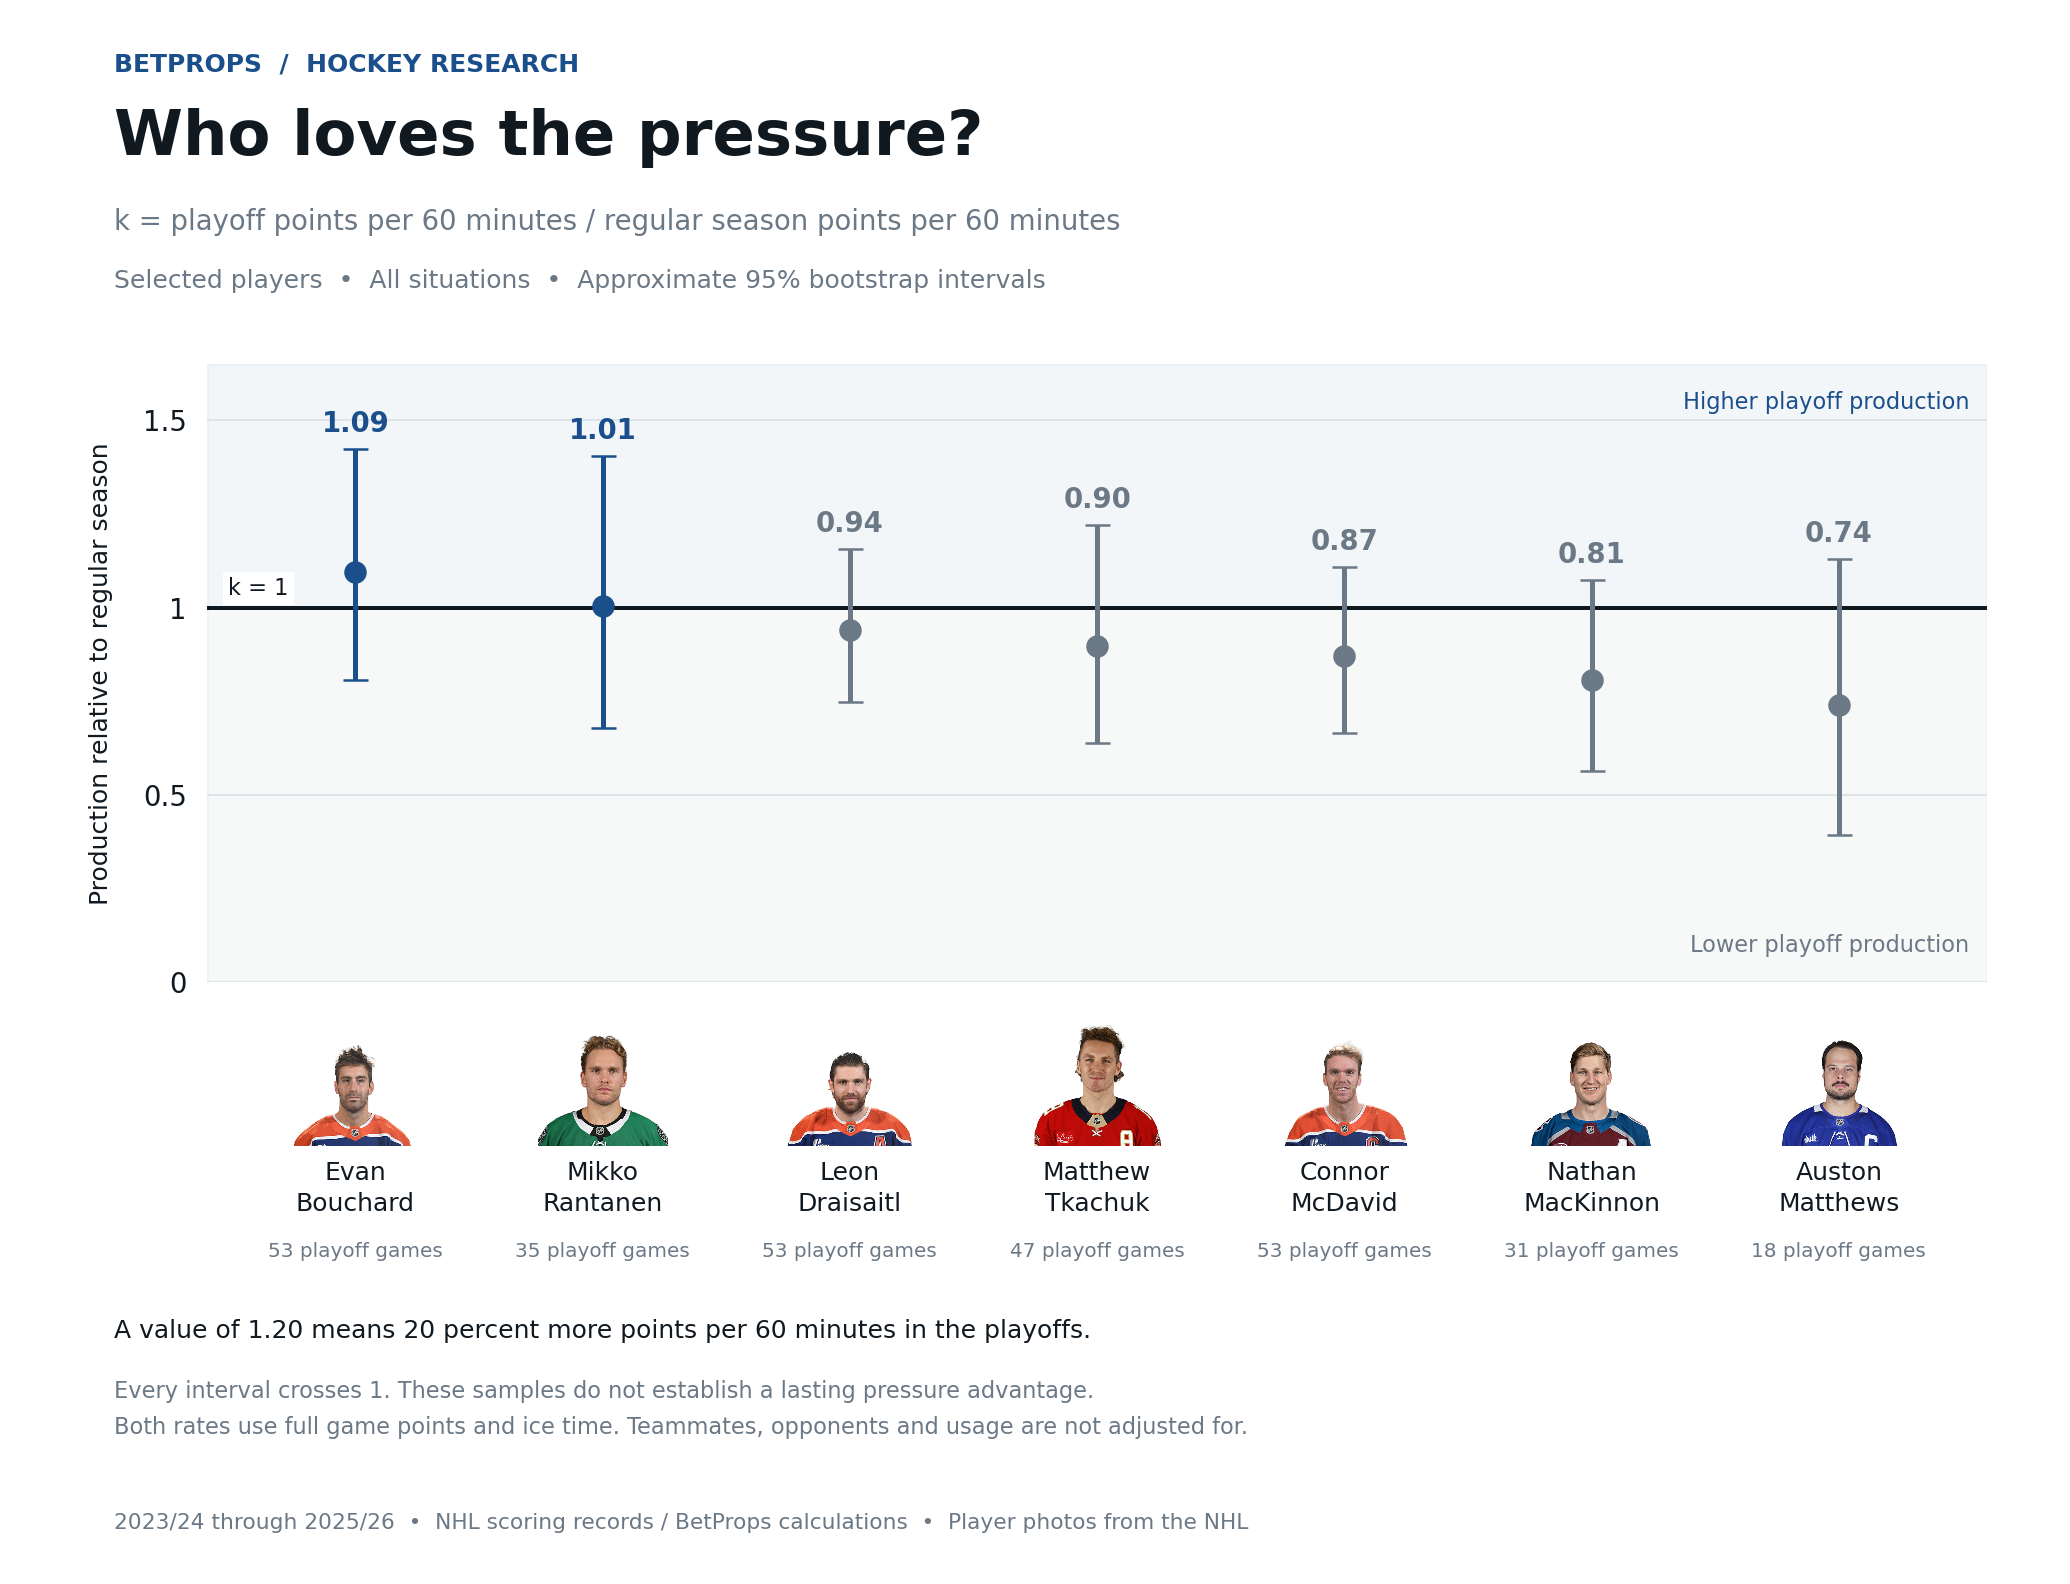
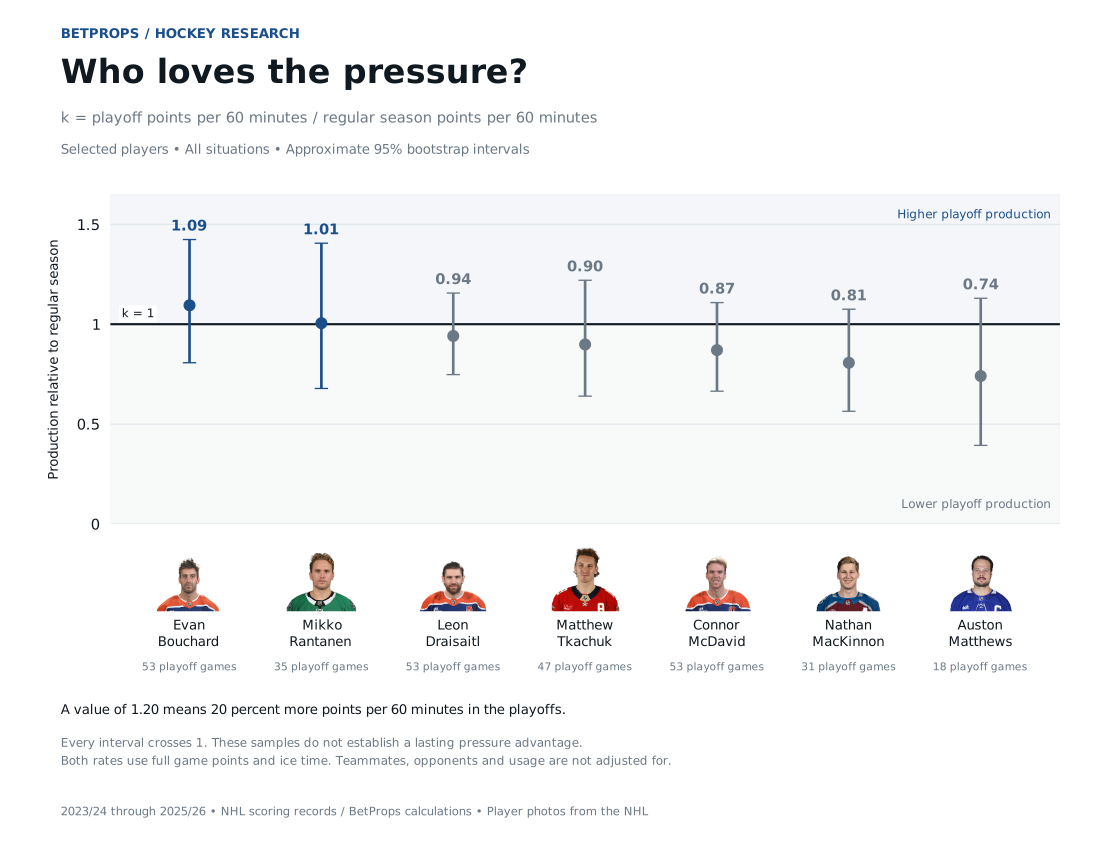
Compare playoff-to-regular-season ratios and uncertainty
A ratio of 1 means the two scoring rates are equal. We resampled each player's games 10,000 times to estimate the intervals below. These use full game points and ice time in both competitions and do not establish significant differences between players.
So, who gets the next shift?
Five minutes left, down a goal. I'd still send McDavid over the boards.
Hertl leads the comeback sample and earned that spot, but extra-attacker minutes drive the board. Draisaitl's overtime finishing is lethal, and eight of his nine goals came with a McDavid assist.
And while McDavid scores roughly 13% below his own regular-season rate in the playoffs, his "slump" still leads the entire NHL. You don't send him because he has a magical clutch switch. You send him because his baseline talent is so high that nobody can catch him even when he's clamped down.
2023/24–2025/26, researched on 18 September 2026; scatterplot game totals checked on 19 September. Rates use points and eligible ice time from the same covered games, except the full-game comparisons noted above. Full scoring totals include every completed game. League ranks require at least 60 eligible minutes; the scatterplot also requires ten playoff appearances. There were 562 regular-season games and 20 playoff games without usable shifts. "Goalie off" comes from the manpower record and can include delayed penalties; overtime excludes shootouts and includes all manpower situations. Hertl's interval resamples eligible games 10,000 times. Shared scoring credits do not measure either player's performance with his teammate off the ice. All 25,597 regulation and overtime goals reconcile to the final scores of the 4,192 games studied. Full methods are below.